File:Zimbabwe inflation rate 2018 to 2019.svg
Jump to navigation
Jump to search

Size of this PNG preview of this SVG file: 483 × 351 pixels. Other resolutions: 320 × 233 pixels | 640 × 465 pixels | 1,024 × 744 pixels | 1,280 × 930 pixels | 2,560 × 1,860 pixels.
Original file (SVG file, nominally 483 × 351 pixels, file size: 125 KB)
Captions
Captions
Add a one-line explanation of what this file represents
Summary[edit]
| Description |
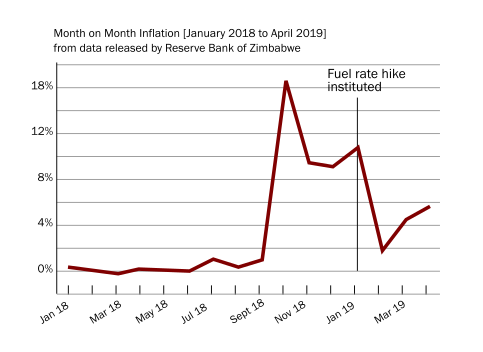
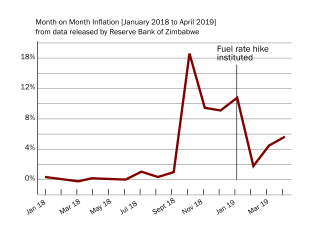
English: Graph of the inflation rate of Zimbabwe's bond currencies for 2018 to 2019. |
| Date | |
| Source | Adapted from data by Reserve Bank of Zimbabwe |
| Author | Own work |
| Permission (Reusing this file) |
This file is licensed under the Creative Commons Attribution 1.0 Generic license.
|
File history
Click on a date/time to view the file as it appeared at that time.
| Date/Time | Thumbnail | Dimensions | User | Comment | |
|---|---|---|---|---|---|
| current | 16:01, 28 May 2019 | | 483 × 351 (125 KB) | Simtropolitan (talk | contribs) | Text to path for corrected years |
| 16:01, 28 May 2019 |  | 483 × 351 (123 KB) | Simtropolitan (talk | contribs) | Corrected years in x axis | |
| 11:34, 28 May 2019 |  | 483 × 351 (125 KB) | Simtropolitan (talk | contribs) | Text to path | |
| 11:33, 28 May 2019 |  | 483 × 351 (17 KB) | Simtropolitan (talk | contribs) | {{Information |description ={{en|1=Graph of the {{w|inflation rate}} of Zimbabwe's bond currencies for 2018 to 2019.}} |date =2019-05-28 |source =Adapted from data by Reserve Bank of Zimbabwe |author =Own work |permission ={{CC-BY}} }} Category:Inflation graphs Category:Economy of Zimbabwe |
You cannot overwrite this file.
File usage on Commons
There are no pages that use this file.
File usage on other wikis
The following other wikis use this file:
- Usage on cs.wikipedia.org
- Usage on en.wikipedia.org
- Usage on ko.wikipedia.org